Maryland leads all 50 states for car insurance cost in 2026 at $3,594 a year for full coverage, followed by Rhode Island ($3,450) and Michigan ($3,079), according to Insurify's 2026 affordability report. Drivers in the 10 priciest states pay 36% to 67% above the $2,158 national average.
Average premiums vary by more than $2,500 between the cheapest state and the most expensive, and the gap keeps widening every year. If you're shopping coverage today, the rates and the rules behind them shift dramatically once you cross a state line, which is why our guide to car insurance requirements by state exists as the home base for every state-by-state breakdown on this site.
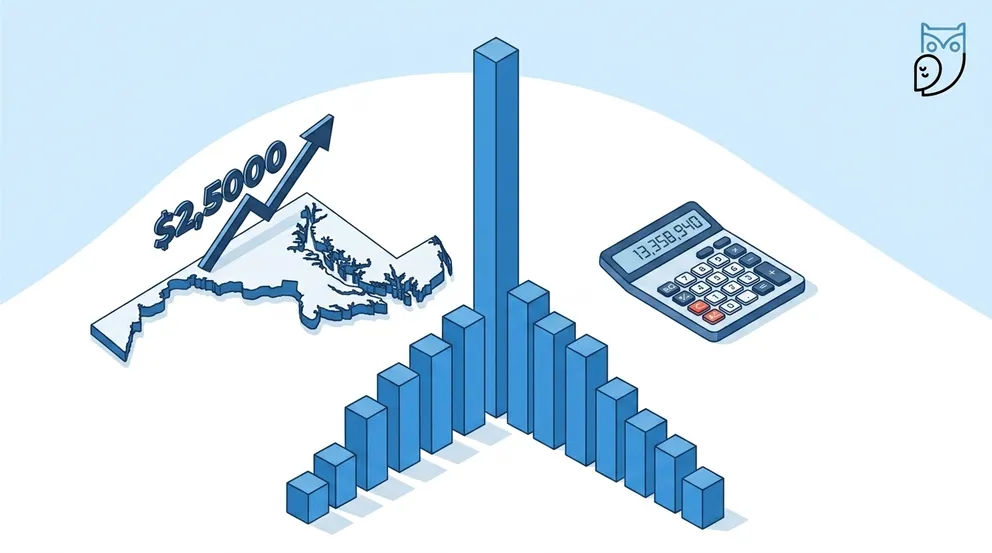
- Maryland tops the state list at $3,594 a year, 67% above the $2,158 national average for 2026.
- The 10 most expensive states saw rates rise 2% in 2025 even as the national average dropped 6%.
- New Jersey premiums jumped 20% in a single year, the steepest state-level increase tracked by Insurify.
- Florida and Michigan both have uninsured driver rates above 19%, well over the 12.6% U.S. average.
- Washington, D.C. averages $4,088 a year, more than any state, after a 47% spike since late 2023.
The 15 Most Expensive States Ranked
Insurify analyzed more than 197 million quotes to project full coverage costs for every state in 2026. Maryland sits at the top of the list with an average premium of $3,594 even after a 9% drop from 2024 peaks. Rhode Island climbed from the 10th most expensive state to third in just two years, with average rates up 41% since the start of 2024.
| Rank | State | 2026 Avg. Annual | vs. U.S. Avg. | Primary Cost Driver |
|---|---|---|---|---|
| 1 | Maryland | $3,594 | +67% | Mandatory PIP and UM, Baltimore-D.C. density, 19.4% uninsured |
| 2 | Rhode Island | $3,450 | +60% | Total-loss reform law, flood risk, small-state pricing swings |
| 3 | Michigan | $3,079 | +43% | No-fault insurance system, 20%+ uninsured, hailstorm losses |
| 4 | New York | $3,041 | +41% | No-fault state, NYC traffic density, repair labor costs |
| 5 | New Jersey | $3,024 | +40% | 20% rate hike in 2025, new minimum coverage rules, urbanization |
| 6 | Delaware | $3,009 | +39% | Vehicle technology costs, post-2024 medical-payment spike |
| 7 | Georgia | $2,992 | +39% | Hurricane Helene flooded 16,800 vehicles, fraud claims |
| 8 | South Carolina | $2,951 | +37% | Staged-accident fraud flagged by NICB, hurricane exposure |
| 9 | Nevada | $2,945 | +36% | Las Vegas urbanization, third-highest vehicle theft rate |
| 10 | Florida | $2,734 | +27% | 20%+ uninsured drivers, hurricane losses, litigation environment |
| 11 | Colorado | $2,578 | +19% | Front Range hailstorms, wildfire exposure, vehicle theft |
| 12 | Texas | $2,477 | +15% | Severe hail, rising medical costs, large catastrophe payouts |
| 13 | Connecticut | $2,404 | +11% | High cost of living, dense Northeast traffic corridor |
| 14 | Louisiana | $2,361 | +9% | Injury claims 200% above national average, hurricane risk |
| 15 | California | $2,333 | +8% | Wildfire exposure, urban density, vehicle theft losses |
Source: Insurify 2026 affordability report, based on full coverage quotes with bodily injury limits between state minimums and 50/100/50, $10,000-$50,000 property damage, and $1,000 deductibles. Figures are 2026 year-end projections from December 2025 baseline rates.
Washington, D.C. technically averages $4,088 and outpaces every state, but it sits outside this state ranking. The capital district saw an 18% spike in 2025 and a 47% jump since late 2023, the largest premium surge in the country.
Why These States Cost So Much: Top 5 Deep Dive
Maryland: Litigation, Density, and Mandatory Extras
Drivers in Maryland fund a coverage stack that most states treat as optional. State law requires personal injury protection plus uninsured motorist coverage on every policy, and a 2024 update forced insurers to offer enhanced underinsured motorist limits, which pushed premiums to a $4,000 peak in March 2025. Maryland's 19.4% uninsured driver rate runs well above the 12.6% national figure tracked by the Insurance Research Council, which means insured drivers absorb the cost of crashes caused by the uninsured. Add traffic between Baltimore and Washington plus a sharp rise in stolen-vehicle claims flagged by the National Insurance Crime Bureau, and the result is the highest state average in the country.
Rhode Island: The Fastest Rising Premium in America
Rhode Island ranked 10th for cost at the start of 2024 and now sits at third with average premiums of $3,450, a 41% surge in two years. A July 2025 state law forces insurers to repair higher-cost vehicles when drivers request it instead of declaring them total losses, which raises claim severity. Severe weather plays a role too, with FEMA declaring a flood emergency in 2024 after storms damaged thousands of vehicles. Rhode Island's small driver population also magnifies pricing swings since a few hundred extra claims move the statewide average noticeably.
Michigan: The No-Fault Tax Meets Hailstorms
Michigan operates one of 12 no-fault systems in the U.S., requiring drivers to file injury claims with their own insurer regardless of fault. Insurify data shows drivers in no-fault states pay more for full coverage on average, and Michigan compounds that with a 20%-plus uninsured driver rate, the fourth-highest in the nation. Climate piled on extra pressure starting in 2023, with consecutive years of more than 100 hail events after seven straight years below that threshold. Premiums rose 12% in 2025, one of only four places in the country that saw double-digit increases.
New York: Density Meets Repair Cost Inflation
New York averages $3,041 a year despite a 13% decline from late-2024 highs near $3,500. Like Michigan, New York runs a no-fault injury system that pushes routine medical claims onto auto insurers. New York City alone produces traffic density that drives both crash frequency and labor rates for body shops. Fatal crashes fell 6% during the first nine months of 2025, which helped pull premiums down, but state averages still run 41% above the national figure.
New Jersey: The Fastest Climber in 2025
New Jersey jumped from the 15th most expensive state to the sixth in a single year, after average premiums climbed 20% in 2025. State regulators approved 69 of 77 carrier requests for rate increases through October. New minimum coverage requirements that took effect at the start of 2026 raised mandatory uninsured and underinsured motorist limits, which is expected to push premiums higher again. Population density does the rest, with New Jersey ranking among the most urbanized states by driver count per square mile.
Where Rates Are Rising Fastest
Four places saw full coverage premiums rise more than 12% during 2025 while the national average dropped 6%. New Jersey led with a 20% increase, followed by Washington, D.C. at 18%, Rhode Island at 13%, and Michigan at 12%. Insurify projects the gap between expensive and affordable states will keep widening through 2026, with Georgia expected to climb another 1.8% while Nebraska sees a 1.4% drop.
The 10 cheapest states cut rates by 12% as a group in 2025, but the 10 priciest states raised rates by 2%. Drivers in expensive states are losing affordability ground every year that passes without shopping for new coverage.
Several factors keep showing up across the high-cost list. Hurricane Helene flooded an estimated 347,000 vehicles in late 2024, with 16,800 in Georgia alone, which pushed catastrophe losses across the Southeast. The five states with the highest uninsured rates, including Mississippi, Tennessee, Florida, Michigan, and Washington, D.C., share a common pattern of premium increases passed onto insured drivers. Litigation-friendly courts in Louisiana run injury claim payouts at roughly 200% of the national average, which translates directly into rate filings.
What to Do If You Live in an Expensive State
Drivers in the top 15 states can't move the statewide cost drivers, but the spread between the cheapest and priciest carriers in any single ZIP code typically runs 40% to 60%. Quoting at least three insurers every six months captures most of that savings. Our guide to what affects car insurance rates breaks down the personal levers that move premiums the most.
Telematics programs can cut premiums 10% to 30% for drivers who score well on braking and mileage. Progressive's Snapshot, State Farm's Drive Safe & Save, and Allstate's Drivewise typically deliver discounts within six months of enrollment, which matters most in states like Maryland and Michigan where the base rate is already inflated.
Raising the comprehensive and collision deductible from $500 to $1,000 typically reduces full coverage premiums by 9% to 15% according to The Zebra's rate analysis. In Maryland that swap could trim $325 off the $3,594 annual average. Bundling auto with homeowners or renters insurance saves another 5% to 25% with most carriers. Reviewing your uninsured motorist limits matters more in states like Florida and Michigan where 1 in 5 drivers carry no coverage at all.
Drivers in the most expensive states should also re-shop after any major life event since carriers price the same risk profile differently after a marriage, home purchase, or vehicle change. The national average cost of car insurance serves as a benchmark for spotting when your rate has drifted above market.
Drivers in Maryland pay roughly $1,436 more a year than the U.S. average, which is enough to cover three months of mortgage interest on a $300,000 home loan at current rates.
Frequently Asked Questions
Maryland has the highest state average at $3,594 a year for full coverage, according to Insurify's 2026 projections. Washington, D.C. averages $4,088, but it isn't a state. Rhode Island and Michigan round out the top three states at $3,450 and $3,079.
Michigan combines a no-fault injury system that routes medical claims through auto insurers, an uninsured driver rate above 20%, and rising hailstorm activity that produced more than 100 hail events in both 2023 and 2024. The state averaged a 12% rate increase in 2025, one of the largest in the country.
Both rank in the top 15 but no longer lead the way. Florida averages $2,734 a year and Louisiana sits at $2,361 in 2026 projections, after fraud reform laws and increased market competition pulled prices down. Both states still run 9% to 27% above the national average due to hurricane exposure and high uninsured rates.
The Zebra reports that the spread between the cheapest and most expensive carriers for the same driver in the same ZIP code typically runs 40% to 60%. In Maryland, that gap can equal $1,400 a year. Insurify customers using its quote tool reported average savings of several hundred dollars after switching, though results vary by state and driver profile.
- Insurify: Car Insurance Prices Tumbled 6% in 2025, 2026 Affordability Report
- MoneyGeek: Car Insurance Rates by State for 2026
- Insurance Research Council: Uninsured and Underinsured Motorists 2017-2023
- National Association of Insurance Commissioners: Uninsured Motorists
- Insurance Information Institute: Facts and Statistics on Uninsured Motorists
- Maryland Insurance Administration: Automobile Insurance Rates
- The Zebra: 2026 Car Insurance Rates by State