Mississippi has the highest uninsured driver rate in the country at 28.2%, followed by New Mexico at 24.1% and Washington, D.C. at 23.1%, according to the Insurance Research Council's 2025 study using 2023 claim data. The national rate hit 15.4% that year, meaning more than one in seven U.S. drivers carries no insurance.
Mississippi drivers face the worst odds in the country, with 28.2% of motorists on the road carrying no insurance, per the Insurance Research Council (IRC) 2025 study based on 2023 claim data. New Mexico ranks second at 24.1%, Washington, D.C. third at 23.1%, and Michigan fourth at 22.3%. If you're trying to figure out what coverage your state requires, the uninsured driver rate where you live should weigh heavily on the optional coverages you stack on top of that legal minimum.
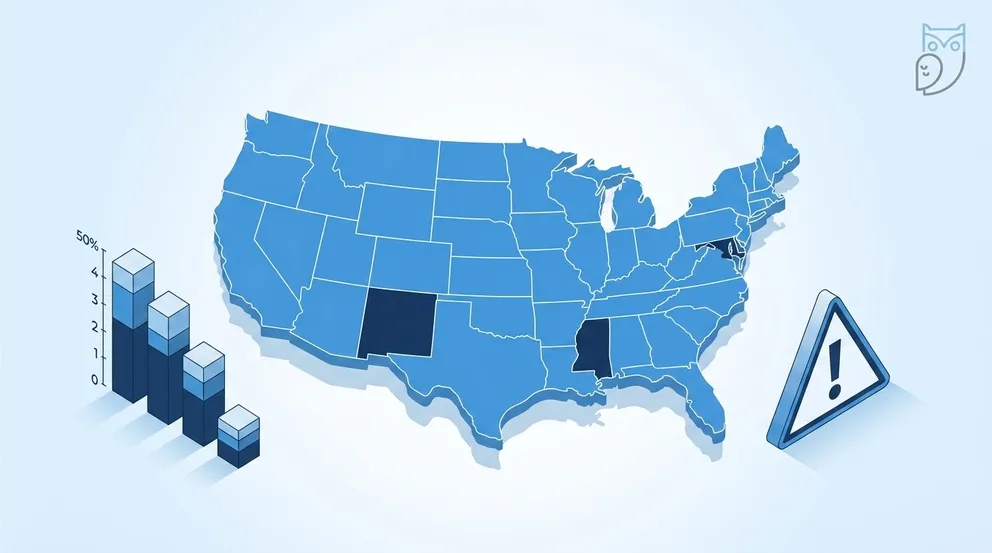
The 10 States With the Most Uninsured Drivers
IRC measures uninsured motorist prevalence by comparing the ratio of injury claims filed by people hit by uninsured drivers to claims filed by people hit by insured drivers. By that yardstick, eight states plus D.C. have rates above 20%, meaning at least one in five drivers on those roads carries no policy. Mississippi tops the list at 28.2%, roughly 1.8 times the national rate of 15.4% and nearly five times Maine's 5.7%.
| Rank | State | Uninsured Rate | vs. National (15.4%) |
|---|---|---|---|
| 1 | Mississippi | 28.2% | +12.8 pts |
| 2 | New Mexico | 24.1% | +8.7 pts |
| 3 | Washington, D.C. | 23.1% | +7.7 pts |
| 4 | Michigan | 22.3% | +6.9 pts |
| 5 | Tennessee | 21.3% | +5.9 pts |
| 6 | Missouri | 20.7% | +5.3 pts |
| 7 | Florida | 20.6% | +5.2 pts |
| 8 | California | 20.4% | +5.0 pts |
| 9 | Colorado | 19.7% | +4.3 pts |
| 10 | Washington | 19.1% | +3.7 pts |
Source: Insurance Research Council, 2025 Uninsured/Underinsured Motorists Study, based on 2023 claim data. Rates calculated as the ratio of UM claims to bodily injury claim frequencies.
All 50 States Ranked by Uninsured Driver Rate (2023)
Maine anchors the bottom of the list with just 5.7% of drivers uninsured, a fivefold gap below Mississippi's 28.2%. Utah (6.2%), Idaho (6.4%), Wyoming (6.7%), and Montana (7.2%) round out the five lowest. Below is every state ranked from highest to lowest using IRC's 2023 figures, the most recent state-level data available.
| Rank | State | Uninsured Rate | vs. National |
|---|---|---|---|
| 1 | Mississippi | 28.2% | +12.8 pts |
| 2 | New Mexico | 24.1% | +8.7 pts |
| 3 | Washington, D.C. | 23.1% | +7.7 pts |
| 4 | Michigan | 22.3% | +6.9 pts |
| 5 | Tennessee | 21.3% | +5.9 pts |
| 6 | Missouri | 20.7% | +5.3 pts |
| 7 | Florida | 20.6% | +5.2 pts |
| 8 | California | 20.4% | +5.0 pts |
| 9 | Colorado | 19.7% | +4.3 pts |
| 10 | Washington | 19.1% | +3.7 pts |
| 11 | Georgia | 19.0% | +3.6 pts |
| 12 | Ohio | 18.5% | +3.1 pts |
| 13 | Delaware | 17.6% | +2.2 pts |
| 14 | Maryland | 16.9% | +1.5 pts |
| 15 | Alabama | 16.8% | +1.4 pts |
| 16 | Wisconsin | 15.6% | +0.2 pts |
| 17 | Illinois | 15.2% | -0.2 pts |
| 18 | Oregon | 14.7% | -0.7 pts |
| 19 | Texas | 14.5% | -0.9 pts |
| 20 | Kentucky | 14.1% | -1.3 pts |
| 20 | New Jersey | 14.1% | -1.3 pts |
| 22 | Indiana | 14.0% | -1.4 pts |
| 23 | Virginia | 12.9% | -2.5 pts |
| 24 | Alaska | 12.5% | -2.9 pts |
| 25 | Rhode Island | 12.4% | -3.0 pts |
| 26 | Arkansas | 12.1% | -3.3 pts |
| 27 | Kansas | 12.0% | -3.4 pts |
| 27 | Oklahoma | 12.0% | -3.4 pts |
| 29 | Connecticut | 11.8% | -3.6 pts |
| 29 | North Carolina | 11.8% | -3.6 pts |
| 29 | Vermont | 11.8% | -3.6 pts |
| 32 | Louisiana | 11.7% | -3.7 pts |
| 33 | Iowa | 11.4% | -4.0 pts |
| 34 | Minnesota | 11.3% | -4.1 pts |
| 35 | Nevada | 11.1% | -4.3 pts |
| 36 | Pennsylvania | 11.0% | -4.4 pts |
| 37 | Arizona | 10.6% | -4.8 pts |
| 37 | North Dakota | 10.6% | -4.8 pts |
| 39 | South Carolina | 10.3% | -5.1 pts |
| 40 | New Hampshire | 10.0% | -5.4 pts |
| 41 | Hawaii | 9.6% | -5.8 pts |
| 42 | Nebraska | 9.5% | -5.9 pts |
| 43 | South Dakota | 9.4% | -6.0 pts |
| 44 | New York | 8.6% | -6.8 pts |
| 45 | Massachusetts | 7.9% | -7.5 pts |
| 46 | West Virginia | 7.8% | -7.6 pts |
| 47 | Montana | 7.2% | -8.2 pts |
| 48 | Wyoming | 6.7% | -8.7 pts |
| 49 | Idaho | 6.4% | -9.0 pts |
| 50 | Utah | 6.2% | -9.2 pts |
| 51 | Maine | 5.7% | -9.7 pts |
Source: Insurance Research Council, 2025 Uninsured/Underinsured Motorists Study, 2023 claim data. National rate: 15.4%.
Why Uninsured Driver Rates Vary So Much State to State
Three factors drive the gap between Mississippi at 28.2% and Maine at 5.7%, and most high-uninsured states share at least two of them.
Affordability. Mississippi's median household income sits around $54,000 per the U.S. Census Bureau, well below the national figure near $78,000, and the state's full-coverage premiums still average around $1,800 per year. New Mexico and Michigan, ranked second and fourth on the uninsured list, both pair below-average incomes with above-average premium costs. When the cheapest legal policy eats 8% to 10% of take-home pay, drivers cancel.
Enforcement and verification. States that run real-time electronic insurance verification systems see lower uninsured rates because gaps in coverage trigger registration suspensions within days. Maine, Utah, and New York operate strong verification programs and rank among the lowest. Mississippi did not have a unified online verification system in place during most of the 2023 study period, and Tennessee's 21.3% rate persists despite the state requiring drivers to carry an insurance card.
The pandemic shock. The IRC data shows the national uninsured rate jumped from 11.6% in 2019 to 14.3% in 2020, then climbed every year through 2023. The District of Columbia, New Jersey, and Missouri logged the largest increases over the 2017 to 2023 stretch. Drivers who dropped coverage during the 2020 lockdowns largely have not come back, and rate hikes averaging 22.6% in 2024 alone (per the Bureau of Labor Statistics CPI) have made the gap harder to close.
The U.S. uninsured rate climbed from 11.6% in 2019 to 15.4% in 2023, a 3.8 percentage point jump in just four years. If the trend continues, the IRC projects roughly one in six drivers will be uninsured by 2027.
The Math: What Happens If an Uninsured Driver Hits You
Picture this scenario in Florida, where 20.6% of drivers carry no insurance. You're stopped at a red light when an uninsured driver rear-ends you at 35 mph, totaling your $28,000 vehicle and sending you to the ER with a herniated disc. Your medical bills run $42,000, lost wages add another $8,500, and your car needs full replacement. The at-fault driver has no policy and no real assets, so a lawsuit recovers nothing.
Without uninsured motorist coverage, you absorb $50,500 in injury costs through health insurance and your own pocket, plus the $28,000 vehicle loss through collision coverage if you have it. With a $100,000/$300,000 UM bodily injury policy plus uninsured motorist property damage, your insurer pays the medical bills, lost wages, and vehicle replacement directly.
Premium ranges per ValuePenguin sample quotes for a 34-year-old driver; payout range per industry claim settlement data.
The IRC found that one in three U.S. drivers is now either uninsured or underinsured, which means even drivers with policies often carry minimum limits too low to cover serious injuries. For a deeper breakdown of how the coverage works and what limits to pick, our guide on uninsured motorist coverage walks through the math by state.
Where UM/UIM Is Required vs. Where You Need It Most
Twenty states and the District of Columbia mandate uninsured motorist coverage on every auto policy, per the III's 2023 state requirements summary. The list includes Connecticut, Illinois, Kansas, Maine, Maryland, Massachusetts, Minnesota, Missouri, Nebraska, New Jersey, New York, North Carolina, North Dakota, Oregon, South Carolina, South Dakota, Vermont, Virginia, West Virginia, and Wisconsin.
Look at that list against the uninsured driver rankings and the mismatch jumps out. Twelve of the highest-uninsured states do not require UM coverage at all.
| State | Uninsured Rate | UM Required? | What This Means |
|---|---|---|---|
| Mississippi | 28.2% | No | Highest risk, optional coverage |
| New Mexico | 24.1% | No | Optional, strongly recommended |
| Michigan | 22.3% | No | Optional under no-fault PIP system |
| Tennessee | 21.3% | No | Optional, often dropped to save money |
| Florida | 20.6% | No | PIP required, UM optional |
| California | 20.4% | No | Insurer must offer, you can reject |
| Colorado | 19.7% | No | Optional add-on |
| Georgia | 19.0% | No | Insurer must offer, you can reject |
| Alabama | 16.8% | No | Optional, often skipped |
| Maine | 5.7% | Yes | Lowest risk, mandatory anyway |
Source: III state requirements summary, December 2023; uninsured rates from IRC 2025 study.
If you live in any of the 12 high-risk states without a mandate, the cost-benefit math points hard toward adding UM/UIM voluntarily. A drive in Mississippi statistically puts you within 50 feet of an uninsured driver during every commute, and skipping a $99 add-on to save $8.25 a month leaves you on the hook for the full medical bill if one of them hits you.
In Mississippi, more than one in four drivers you pass carries no insurance, but the state does not require you to buy UM coverage. That gap explains why personal-injury attorneys call UM "the most undersold protection in American auto policies."
Drivers in expensive-to-insure states face a related squeeze: the states with the highest car insurance rates often overlap with the states pushing drivers off coverage entirely, creating a feedback loop where insured drivers fund the cost of uninsured ones through higher UM premiums.
Frequently Asked Questions
Mississippi has the highest uninsured driver rate at 28.2%, according to the Insurance Research Council's 2025 study using 2023 claim data. New Mexico (24.1%) and Washington, D.C. (23.1%) follow. The national rate sits at 15.4%, the highest level recorded since IRC began tracking the metric.
Yes, especially in any of the 12 high-uninsured states without a UM mandate, including Mississippi, Florida, California, and Tennessee. UM/UIM coverage typically adds $86 to $199 per year, which is roughly 5% to 10% of your total premium, but it can pay out $10,000 to $60,000 or more when an uninsured driver hits you. The math favors carrying it almost everywhere.
Three factors drive the gap: affordability (states with low incomes and high premiums see drivers cancel coverage), enforcement (states with real-time electronic insurance verification see lower rates), and post-pandemic trends (the national rate jumped from 11.6% in 2019 to 15.4% in 2023). The District of Columbia, New Jersey, and Missouri logged the steepest increases over that period.
- Insurance Information Institute: Facts + Statistics: Uninsured Motorists (2023 state ranking)
- Insurance Research Council: Uninsured and Underinsured Motorists 2017-2023 (2025 Study Summary)
- Bankrate: Uninsured Motorist Statistics and Facts
- ValuePenguin: Uninsured and Underinsured Motorist Coverage Cost Analysis
- Insurance Information Institute: Automobile Financial Responsibility Limits by State (December 2023)
- U.S. Bureau of Labor Statistics: Consumer Price Index, Auto Insurance
- Insurify: Uninsured Motorist Coverage Guide